Data Mapping for Tableau Dashboards
Case Study
Client
Our client enables hospitals, health systems, and independent labs to respond to current challenges and even thrive in today’s unpredictable and ever-changing environment. They accelerate results for more than 1,000 US hospitals and health systems by providing expert resources, extensive operational and clinical data, as well as analytics technology.

Business Challenge
In the healthcare industry, data plays a key role in making strategic decisions for hospitals and large healthcare facilities. Our client was tasked to work with a group of hospitals and healthcare facilities to provide them with data solutions to improve their operational awareness and decision-making abilities. Their goal was to organize their unstructured data and create dashboards that were easy to read and understand. These dashboards would be used by executives at the healthcare facilities to better manage facility operations as well as understand how aspects of their operation compared to others in the medical industry, leading to better patient care and a more efficient system.
Solution
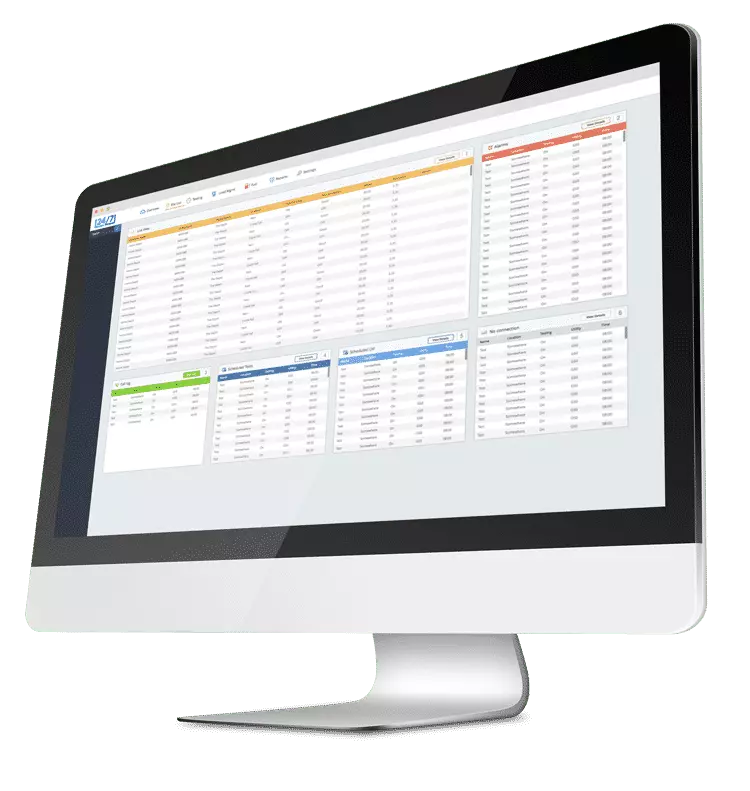
The root objective, and challenge, of dealing with data in most organizations is to transform unstructured external data into structured internal data by extracting vast amounts of data from disparate sources in a variety of formats, loading the data into your own data storage systems, and transforming the data into a form that is useful to data analysts and other data professionals. In this case, the structured warehouse data was used by our client’s data analysts to create Tableau visualizations that give insight into operations.
To achieve this goal, the team first needed to extract data that was being pushed to their client’s electronic health record (EHR) systems (TCP/IP, Web Services, File System, or FTP), parse the various EHR formats (HL7, delimited, FHIR, etc.) and then, transfer this data into an interim data store. To simplify this extraction process, the team employed a proprietary third-party integration engine called Rhapsody to capitalize on their commoditized solutions to integrate and parse standardized data sources and formats.
Next, through a series of scripts, service buses, message queues, and web API’s, the interim data was ingested into a structured data warehouse database and mapped to data types easily consumed by standardized Tableau dashboards. The technologies used for data storage in the ingestion pipeline were primarily MS SQL, Rabbit MQ, PostGRES, and C# Web API’s. The complete data pipeline runs in batches throughout the day to support our clients in visualizing their operational data through Tableau analytics and dashboards.
"Our goal was to transform unstructured external data into structured internal data by extracting vast amounts of data from disparate sources in a variety of formats and transforming it into a form that is useful to data analysts and other data professionals."
Results
SOLTECH’s team successfully extracted raw, unstructured data and loaded it into a warehouse where data could be used to perform analytics and create Tableau useful reports for the management team. The team’s use of key technologies, such as the Rhapsody integration engine, workflow orchestration, message queueing, etc., to successfully optimize the mapping and warehousing of data significantly enhanced the ingestion performance which translated into faster reporting.
Impact
With the new data dashboards, healthcare facilities were able to streamline their operations, increase efficiency, and ultimately, save lives. Leveraging the data solution that SOLTECH created, our client is now in a position to self-sufficiently create on-going specific reports needed by their hospital and healthcare facility clients.

